Capítulo 39 Correlação
39.1 Correlação de Pearson (\(r\))
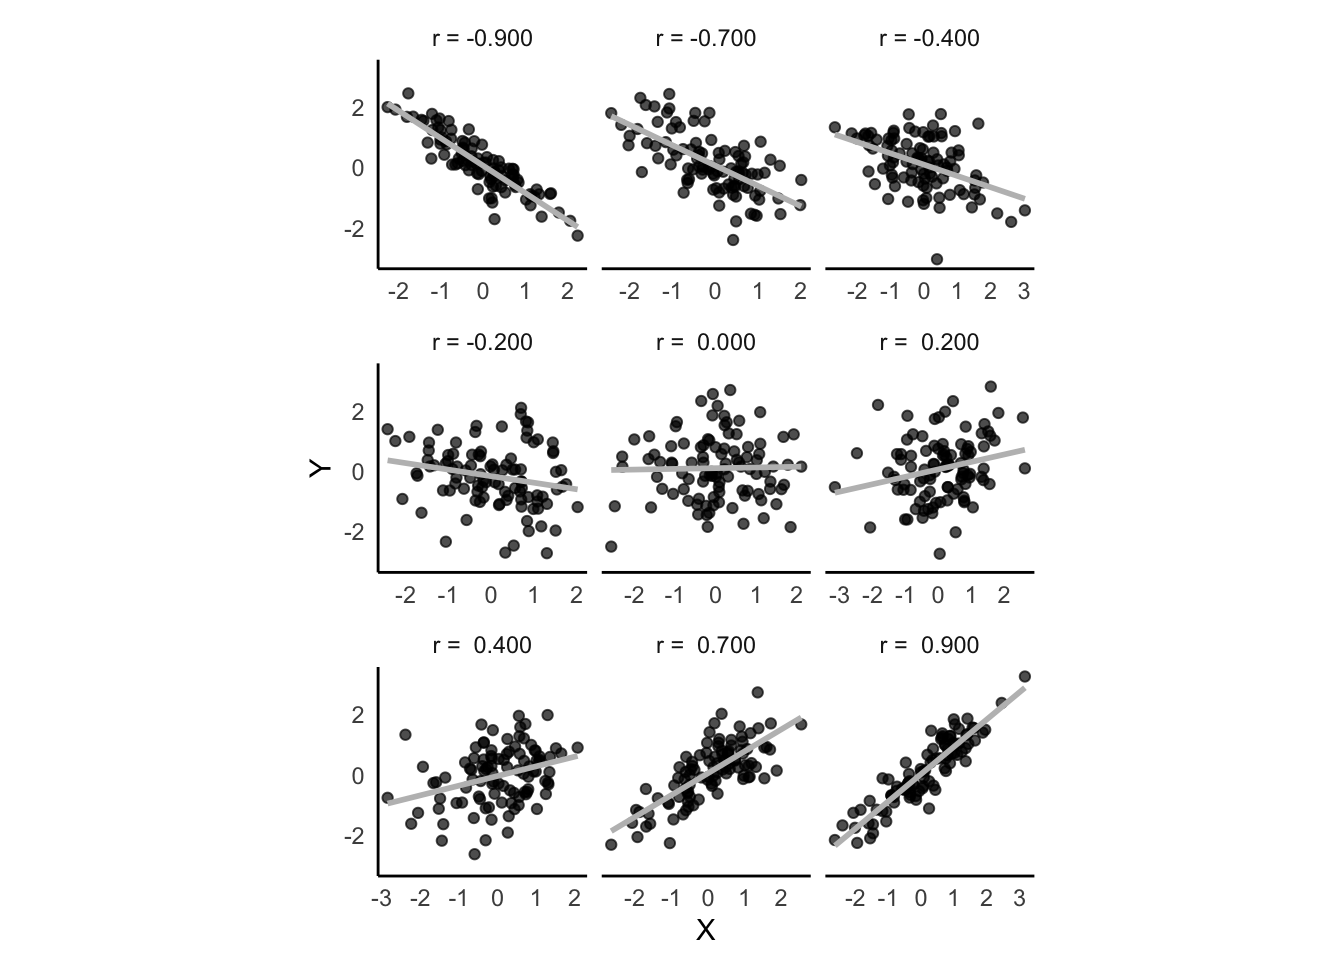
Figura 39.1: Diferentes forças e direção de correlação entre duas variáveis X e Y.
O pacote stats159 fornece a função cor.test para calcular o coeficiente de correlação de Pearson (\(r\)).
O pacote correlation365 do projeto easystats366 fornece a função correlation para calcular o coeficiente de correlação de Pearson (\(r\)).
O pacote psychmeta367 fornece a função correct_r_coarseness para calcular o coeficiente de correlação desatenuado (\(r_{x'y'}\)).
O pacote psychmeta367 fornece a função correct_r para calcular o coeficiente de correlação em escala restrita e/ou com erro de mensuração (\(r_{x'y'}\)).
39.2 Correlação de Spearman (\(\rho\))
O pacote stats159 fornece a função cor.test para calcular o coeficiente de correlação de Spearman (\(\rho\)).
O pacote correlation365 do projeto easystats366 fornece a função correlation para calcular o coeficiente de correlação de Spearman (\(\rho\)).
39.3 Coeficiente de Kendall (\(\tau\))
O pacote stats159 fornece a função cor.test para calcular o coeficiente de correlação de Kendall \(\tau\).
O pacote correlation365 do projeto easystats366 fornece a função correlation para calcular o coeficiente de correlação de Kendall \(\tau\).
39.4 Correlação bisserial (\(r_{s}\))
O pacote psych368 fornece a função tetrachoric para calcular o coeficiente de correlação bisserial (\(r_{s}\)).
39.5 Correlação tetracórica (\(r_{tet}\))
O pacote psych368 fornece a função tetrachoric para calcular o coeficiente de correlação tetracórica (\(r_{tet}\)).
39.6 Correlação policórica (\(r_{pol}\))
O pacote psych368 fornece a função tetrachoric para calcular o coeficiente de correlação policórica (\(r_{pol}\)).
39.10 Coeficiente de Sheperd (\(\phi\))
O pacote correlation365 do projeto easystats366 fornece a função correlation para calcular o coeficiente de correlação de Sheperd \(\phi\).
O pacote corrplot242 fornece a função corrplot para visualização da matriz de correlação.
O pacote corrplot242 fornece a função cor.mtest para calcular os P-valores e intervalos de confiança da matriz de correlação.